
Asthma Disparities and Rural Health
Asthma is a major non-communicable respiratory disease impacting approximately 8.4% of adults in the United States. Our research investigates rural and ethnic disparities in asthma severity prevalence among U.S. Hispanic populations using the All of Us Research Program. Few studies have investigated the role of rurality on asthma outcomes in minority populations, making this work critical for understanding health disparities in underserved communities.
Using a cross-sectional study design with 372,771 participants from the All of Us Research Program, we examined associations between rurality, ethnicity, and asthma severity outcomes. Our findings reveal significant disparities in asthma severity prevalence by geography and ethnicity, with rural Hispanic populations facing unique challenges in asthma management and healthcare access.
Study Population Characteristics by Ethnicity (N = 372,771)
| Variable | Total (N = 372,771) | Hispanic (N = 8,606) | Non-Hispanic (N = 364,165) | p-value |
|---|---|---|---|---|
| BMI, Mean (SD) | 32.65 (8.64) | 33.31 (9.10) | 32.64 (8.63) | <0.0001 |
| Sex at birth, n (%) Female |
289,043 (77.54) | 6,969 (80.98) | 282,074 (77.46) | <0.0001 |
| Race, n (%) White |
308,201 (82.68) | 6,795 (78.96) | 301,406 (82.77) | <0.0001 |
| Rurality, n (%) Rural |
7,354 (10.59) | 243 (17.11) | 7,111 (10.46) | <0.0001 |
| SES, n (%) Low |
27,027 (30.45) | 1,075 (46.70) | 25,952 (30.02) | <0.0001 |
Sociodemographic characteristics stratified by ethnicity from the All of Us Research Program. Hispanic participants were significantly more likely to live in rural areas (17.11% vs 10.46%) and have lower socioeconomic status (46.70% vs 30.02% low SES).
Using advanced machine learning algorithms including Multivariate Adaptive Regression Splines (MARS) and Conditional Inference Trees (CIT), we investigated complex relationships between demographic factors and asthma prevalence in Hispanic populations. This comprehensive analysis of 21,069 Hispanic participants from the All of Us Research Program revealed important non-linear relationships and interaction effects that traditional statistical methods might miss.
Our machine learning approach identified BMI as the most influential predictor of asthma, with additional significant effects of age, sex, rural residence, income, and education. Among the 21,069 Hispanic participants, 2,011 individuals had asthma and 19,058 did not have asthma based on electronic health records. The analysis revealed that Hispanic individuals living in rural areas had 50% higher odds of having asthma (AOR = 1.501, 95% CI: 1.301–1.729), and each unit increase in BMI was associated with a 3.0% increase in the odds of having asthma (AOR = 1.030, 95% CI: 1.023–1.037).
Asthma Prevalence by Key Demographic Subgroups Among Hispanic Participants
| Variable | Subgroup | Asthma (Yes) N = 2,011 | Asthma (No) N = 19,058 | χ² Statistic | p-value |
|---|---|---|---|---|---|
| Sex | Female | 1,573 (10.6%) | 13,199 (89.4%) | 69.31 | <2.2e-16 |
| Male | 438 (7.0%) | 5,859 (93.0%) | |||
| Rural Residence | Urban | 1,622 (9.0%) | 16,429 (91.0%) | 45.19 | 1.79e-11 |
| Rural | 389 (12.9%) | 2,629 (87.1%) | |||
| Education | Less than High School | 291 (7.7%) | 3,507 (92.3%) | 39.33 | 2.04e-07 |
| High School/GED | 390 (10.2%) | 3,424 (89.8%) | |||
| Some College | 620 (10.9%) | 5,047 (89.1%) | |||
| College Graduate+ | 653 (8.9%) | 6,667 (91.1%) |
Chi-square test results showing significant associations between asthma status and demographic variables among Hispanic participants (N = 21,069). Rural residents show 43% higher asthma prevalence compared to urban residents.
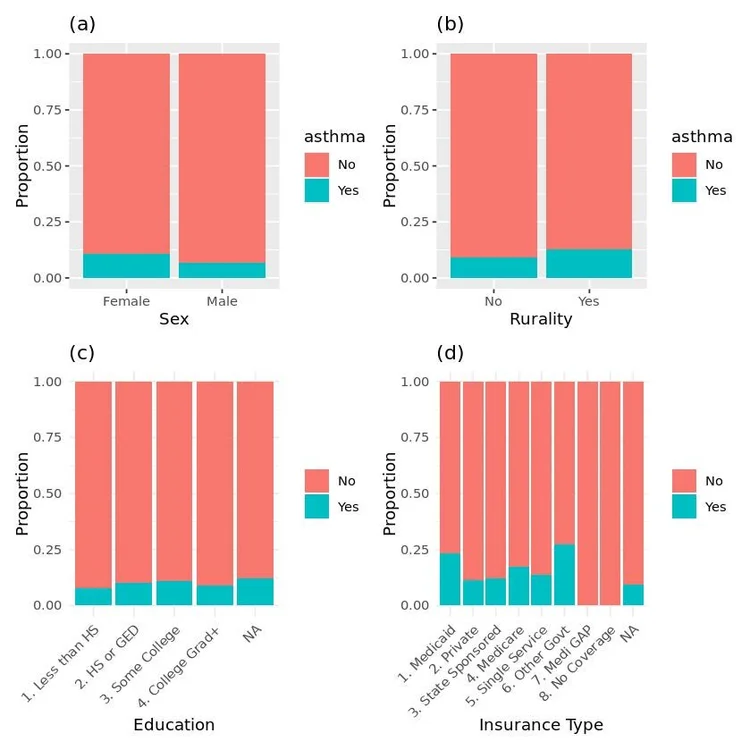
Figure 1: Proportions of individuals with and without asthma across demographic and socioeconomic variables among Hispanic participants. (a) Sex at birth, (b) Rural vs urban residence, (c) Education level, (d) Insurance coverage type.
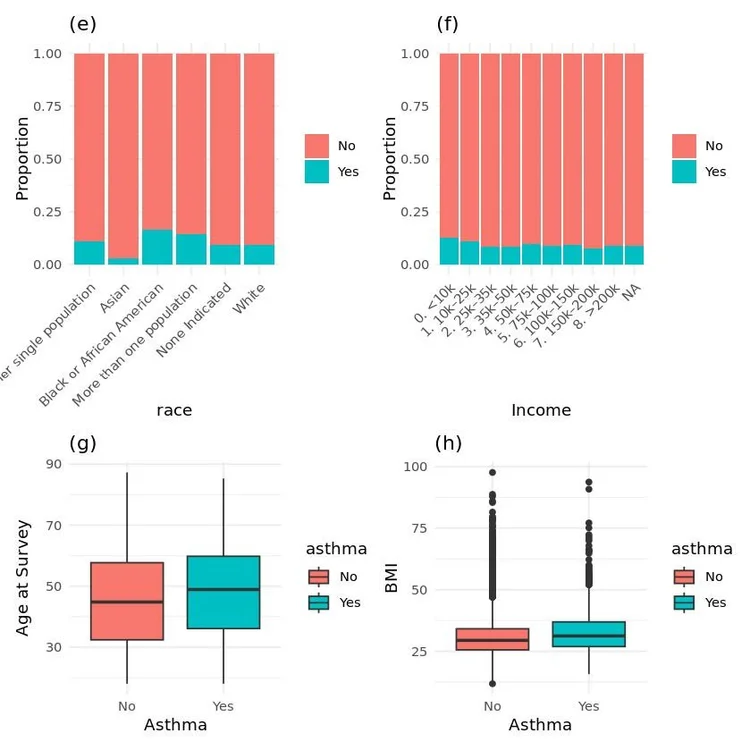
Figure 2: Distribution of asthma prevalence by race, income, age, and BMI among Hispanic participants. (e) Race, (f) Income category, (g) Age boxplot, (h) BMI boxplot stratified by asthma status.
Machine Learning Model Results: Key Predictors
Conditional Inference Tree analysis identified BMI as the primary split variable (p < 0.001), with subsequent splits revealing complex interactions between demographic and socioeconomic factors.
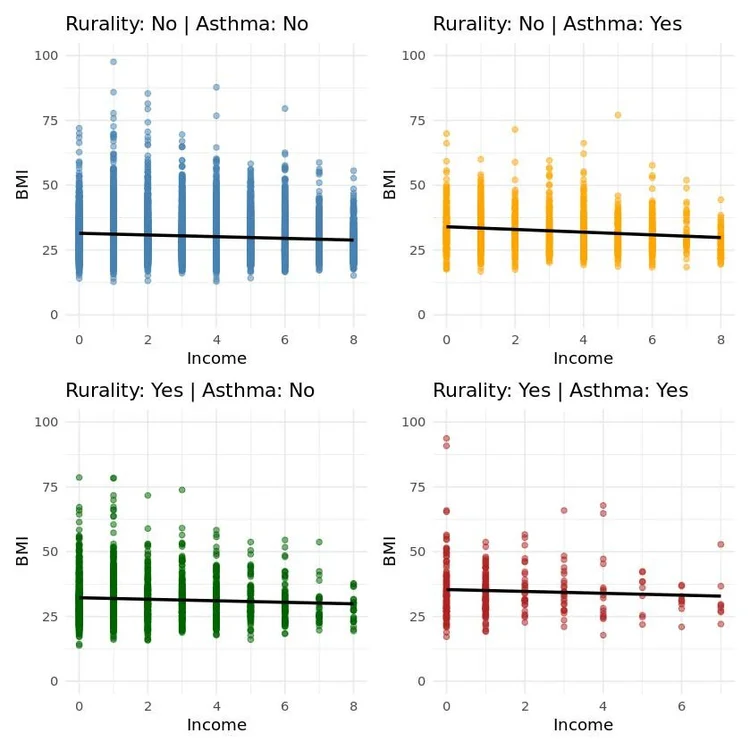
Figure 3: Scatter plots with trend lines illustrating the relationship between income and BMI among Hispanic individuals, stratified by rurality and asthma status. Shows clear negative association between income and BMI across all groups.
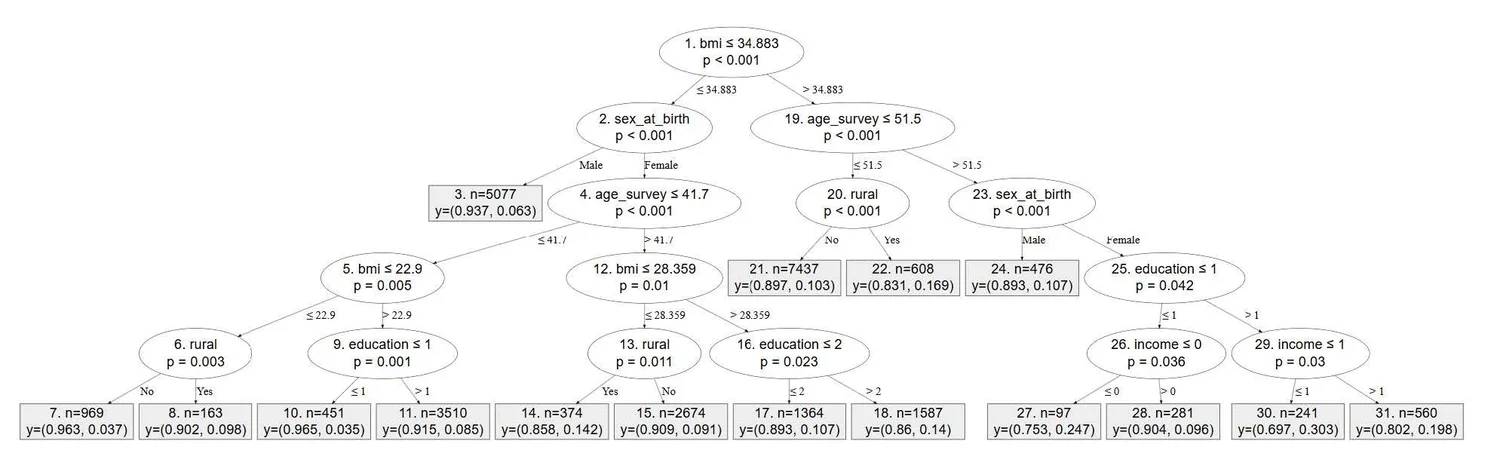
Figure 4: Classification results using the Conditional Inference Tree method to identify significant predictors of asthma among Hispanic individuals. BMI emerges as the most significant initial split (p < 0.001), with subsequent splits by sex, age, education, and income revealing complex interaction effects.
Our research reveals complex relationships between socioeconomic status, healthcare access, and asthma outcomes in Hispanic populations. Rural Hispanic families experience significant barriers to care, including transportation challenges, provider shortages, and insurance gaps. These factors contribute to delayed diagnosis, inadequate management, and worse asthma outcomes.
Paradoxically, our findings suggest that having insurance resulted in higher odds of more severe asthma types, which may indicate delayed access to care, underdiagnosis in rural settings, or lack of adherence to asthma medication. Lower socioeconomic status and being uninsured increased the odds of uncomplicated and unspecified asthma, while insurance coverage elevated the odds of moderate and severe persistent asthma.
Adjusted Odds Ratios for Asthma Severity Types
| Variable | Unspecified Asthma | Mild Persistent | Moderate Persistent | Severe Persistent |
|---|---|---|---|---|
| Rural (vs Non-Rural) | 1.12 (1.06-1.17) | 0.50 (0.44-0.56) | 1.94 (1.82-2.06) | 0.55 (0.48-0.62) |
| Hispanic (vs Non-Hispanic) | 0.97 (0.93-1.01) | 0.75 (0.69-0.83) | 0.56 (0.51-0.61) | 1.05 (0.96-1.15) |
| Male (vs Female) | 0.87 (0.86-0.89) | 1.16 (1.13-1.20) | 0.99 (0.97-1.02) | 0.90 (0.87-0.93) |
| Age 18-64 (vs 0-11) | 3.08 (2.88-3.30) | 1.56 (1.34-1.82) | 1.89 (1.65-2.18) | 3.68 (2.84-4.77) |
| Low SES (vs High) | 0.83 (0.81-0.85) | 1.43 (1.35-1.51) | 1.08 (1.03-1.12) | 0.78 (0.75-0.82) |
| Insured (vs Uninsured) | 1.85 (1.60-2.13) | 0.15 (0.13-0.17) | 2.67 (1.89-3.79) | 2.98 (1.82-4.89) |
Adjusted odds ratios and 95% confidence intervals for asthma severity types. Models adjusted for ethnicity, sex at birth, race, asthma age, SES, and health insurance. Bold indicates statistical significance at p ≤ 0.05.
Our research leverages the comprehensive All of Us Research Program dataset, which represents one of the largest and most diverse health databases in the United States. Using version 8 of the Registered Tier Dataset, we conducted rigorous cross-sectional analyses to investigate rural and ethnic disparities in asthma severity prevalence among Hispanic and non-Hispanic participants.
The All of Us platform provides unique advantages for disparities research, including overrepresentation of underserved populations, comprehensive electronic health records integration, and standardized data collection protocols. Our methodological approach combined traditional epidemiological methods with advanced machine learning techniques to capture complex, non-linear relationships between risk factors. Rurality was defined using a proxy measure from participants who answered "Yes" to living in a rural area where distance to healthcare providers is too far and experiencing transportation issues related to healthcare services.
All of Us Research Program Analytical Framework
Data Sources
- Electronic Health Records (EHR)
- The Basics Survey
- Healthcare Access & Utilization Survey
- Physical measurements
Population
- Total cohort: 372,771 participants
- Hispanic participants: 8,606
- Non-Hispanic participants: 364,165
- ML study: 21,069 Hispanic participants
Statistical Methods
- Binary logistic regression
- Chi-square tests
- MARS algorithms
- Conditional Inference Trees
Outcome Measures
- Unspecified/uncomplicated asthma
- Mild persistent asthma
- Moderate persistent asthma
- Severe persistent asthma
SNOMED (Systematized Nomenclature of Medicine) and ICD-10 (International Classification of Diseases, Tenth Revision) codes were used to extract data on asthma diagnoses. Asthma severity types included unspecified/uncomplicated asthma, mild persistent asthma, moderate persistent asthma, and severe persistent asthma.
All of Us Research Program Studies
Investigating asthma disparities in rural Hispanic communities using machine learning algorithms in the All of Us platform: a nationwide study
Funded SubmittedComprehensive machine learning analysis of 21,069 Hispanic participants examining complex relationships between demographic factors, rurality, and asthma prevalence using MARS and CIT algorithms.
Rural and ethnic disparities in asthma severity prevalence in U.S. Hispanic adults: a cross-sectional analysis
Funded SubmittedLarge-scale epidemiological study of 372,771 participants investigating associations between rurality, ethnicity, and asthma severity outcomes using traditional statistical approaches.